
Software Modeling refers to the process of creating visual representations of various aspects of a software system. These visual models help developers, designers, and stakeholders better understand and communicate complex concepts, structures, and behaviors. Modeling plays a crucial role in the design, analysis, and documentation of software systems, allowing for improved clarity, collaboration, and decision-making throughout the development lifecycle.

Key Aspects of Modeling
Abstraction
Models simplify complex real-world systems by abstracting away unnecessary details and focusing on the most relevant aspects.
Visualization
Visual models provide a clear and intuitive way to represent system components, relationships, and interactions.
Communication
Models serve as a common language that developers, designers, stakeholders, and team members can use to discuss and convey ideas.
Analysis
Models allow for analysis and validation of system behaviors, structure, and interactions before actual development begins.
Design
Models help designers plan and organize the architecture, components, and workflows of the software.
Types of Software Models
Use Case Diagrams
A Use Case Diagram is a visual representation used in software development to depict the interactions between users (actors) and a system’s various use cases. Use Case Diagrams are part of the Unified Modeling Language (UML) and provide a high-level overview of the system’s functionality and the ways users interact with it. They are particularly useful for communicating system behavior to stakeholders and for understanding the system’s scope and requirements.
Components of a Use Case Diagram
Actors: Actors are external entities (such as users, other systems, or hardware) that interact with the system. They are represented as stick figures.
Use Cases: Use cases represent the specific actions, tasks, or functionalities that the system provides to users. They are represented as ovals.
Relationships: Relationships between actors and use cases are depicted using lines. These relationships show how actors are involved in various use cases.
Creating a Use Case Diagram
Identify the main actors that will interact with the system. These are the individuals or entities who will initiate actions within the system.
Identify the primary use cases that represent the main functionalities or tasks that the system provides.
Draw the actors and use cases on the diagram, placing them in appropriate positions to represent their relationships.
Connect actors to the relevant use cases with lines to indicate which use cases each actor is associated with.
If necessary, use generalization and specialization relationships to show commonalities or hierarchies among actors.

Types of Relationships
Association: An association represents a communication link between an actor and a use case. It indicates that the actor interacts with the use case.
Include Relationship: An include relationship indicates that one use case includes the functionality of another use case. It is represented by a dashed arrow from one use case to another.
Extend Relationship: An extend relationship indicates that one use case can be extended with additional behavior provided by another use case. It is represented by a dashed arrow from the base use case to the extension use case.
Benefits of Use Case Diagrams
Visual Clarity: Use Case Diagrams provide a clear visual representation of the system’s interactions and functionalities.
Stakeholder Communication: They help communicate system behavior to both technical and non-technical stakeholders.
Scope Definition: Use Case Diagrams define the boundaries of the system by identifying the key functionalities it provides.
Requirement Analysis: They aid in capturing and understanding user requirements and expectations.
Basis for Design: Use Case Diagrams can guide the system’s architectural and design decisions.
Test Planning: Use Case Diagrams provide insights for creating test cases that cover various user scenarios.
In summary, Use Case Diagrams offer a concise and user-centered view of a software system’s behavior. They are valuable tools for visualizing user interactions, capturing requirements, and communicating the system’s scope to stakeholders and development teams.
Class Diagrams
A Class Diagram is a fundamental type of diagram used in object-oriented modeling and design to represent the static structure of a software system. It provides a visual representation of classes, their attributes, methods, and the relationships between classes. Class Diagrams are part of the Unified Modeling Language (UML) and are widely used in software development to illustrate the design and architecture of object-oriented systems.
Components of a Class Diagram
Class: Represents a blueprint or template for creating objects. It includes attributes (data members) and methods (functions) that define the behavior of the objects.
Attributes: Represent the properties or data members of a class. They describe the characteristics that objects of the class will possess.
Methods: Represent the behaviors or functions that objects of a class can perform. They define the operations that can be invoked on objects.
Associations: Depict the relationships between classes. Associations indicate that objects of one class can be related to objects of another class. Associations can have multiplicities (cardinalities) to indicate the number of related objects.
Aggregation and Composition: Special types of associations that represent whole-part relationships between classes. Aggregation implies a “has-a” relationship, while composition implies a stronger ownership relationship.
Inheritance (Generalization and Specialization): Represents an “is-a” relationship between classes. Subclasses inherit attributes and methods from their parent (superclass) classes.
Dependency: Represents a weaker form of relationship where one class depends on another class, but not in a structural manner.
Multiplicity: Indicates how many objects participate in a relationship. For example, “1” or “0..1” signifies a single object, while “1..*” represents one or more objects.

Creating a Class Diagram
Identify the classes in your software system along with their attributes and methods.
Identify the relationships between classes, considering associations, aggregations, compositions, and inheritance.
Draw the classes as rectangles, with attributes listed in the rectangle body and methods listed below.
Use lines with arrows to depict relationships and associations between classes.
Label the associations with multiplicities to specify the number of objects involved.
Benefits of Class Diagrams
Visual Representation: Class Diagrams provide a visual overview of the structure and relationships of classes within a software system.
Design Communication: They help communicate the software’s architecture, relationships, and design decisions to both technical and non-technical stakeholders.
Code Planning: Class Diagrams provide insights for writing code by defining classes, attributes, and methods.
Design Validation: They aid in validating the design against requirements, ensuring that the system’s structure aligns with its intended functionality.
Basis for Code Generation: Class Diagrams can serve as a basis for automatically generating code skeletons or templates.
In summary, Class Diagrams are essential tools for designing and visualizing the static structure of object-oriented software systems. They facilitate communication among developers, guide the coding process, and contribute to the overall quality of the software’s design and architecture.
Sequence Diagrams
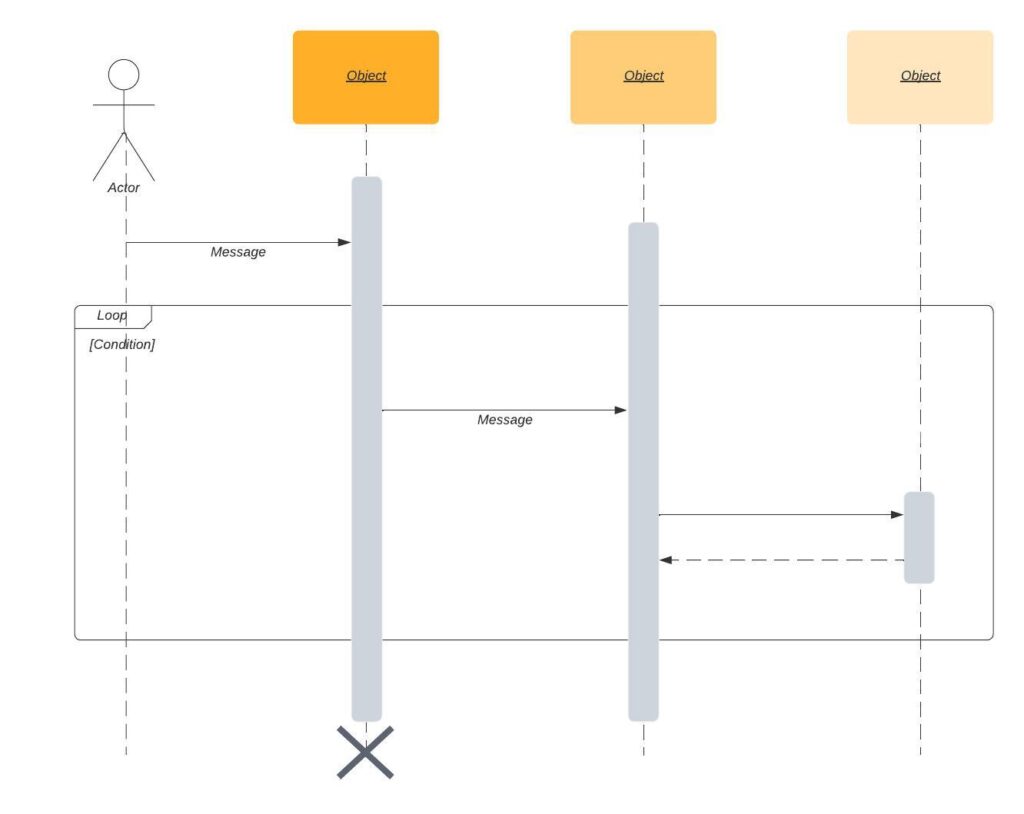
A Sequence Diagram is a type of diagram used in software modeling and design to illustrate the interactions and order of messages exchanged between different components (objects) within a software system. Sequence Diagrams provide a dynamic view of how objects collaborate to achieve specific functionalities or scenarios. They are part of the Unified Modeling Language (UML) and are commonly used to visualize the behavior of systems with a focus on time and order of events.
Components of a Sequence Diagram
Objects (Lifelines): Represent instances of classes or components participating in the interaction. They are depicted as vertical lines (lifelines) with the object’s name at the top.
Messages: Represent the interactions between objects. Messages can be synchronous (blocking), asynchronous (non-blocking), or self-referential (sent by an object to itself).
Activation Bar: Represents the time during which an object is actively processing a message. It is shown as a dashed line extending vertically from a lifeline.
Return Messages: Indicate the response messages sent from the called object back to the caller.
Fragment (Combined Fragment): Represents a group of messages that have a specific interaction pattern, such as loops, conditionals, or alternative flows.
Creating a Sequence Diagram
Identify the objects and components involved in the interaction scenario.
Determine the sequence of messages exchanged between objects to achieve the desired behavior.
Arrange the objects’ lifelines vertically along the top of the diagram.
Draw arrows between lifelines to represent the messages being exchanged, indicating the order of communication.
Use activation bars to show when an object is processing a message and when it’s idle.
Optionally, use fragments to represent complex behavior patterns.
Benefits of Sequence Diagrams
Visualizing Interactions: Sequence Diagrams provide a visual representation of how objects interact and communicate during a specific scenario.
Understanding Behavior: They help developers and stakeholders understand the dynamic behavior of the system and the sequence of events.
Design Validation: Sequence Diagrams aid in validating that the design meets the intended behavior and requirements.
Detecting Issues: They can reveal potential issues, such as timing conflicts, deadlocks, or incorrect message flows.
Communication Tool: Sequence Diagrams are effective communication tools for discussing interaction scenarios among team members and stakeholders.
Basis for Implementation: They can be used as a reference for implementing the actual code that performs the described interactions.
Limitations of Sequence Diagrams
Sequence Diagrams focus on a specific scenario and may not provide a complete overview of the system’s behavior.
They might become complex for scenarios with many objects and interactions.
They emphasize the order of events, but not the overall system architecture.
In summary, Sequence Diagrams are valuable tools for capturing and visualizing the dynamic interactions between objects within a software system. They are particularly useful for understanding how different components collaborate to achieve specific functionalities and for validating the correctness of design and behavior.
Activity Diagrams
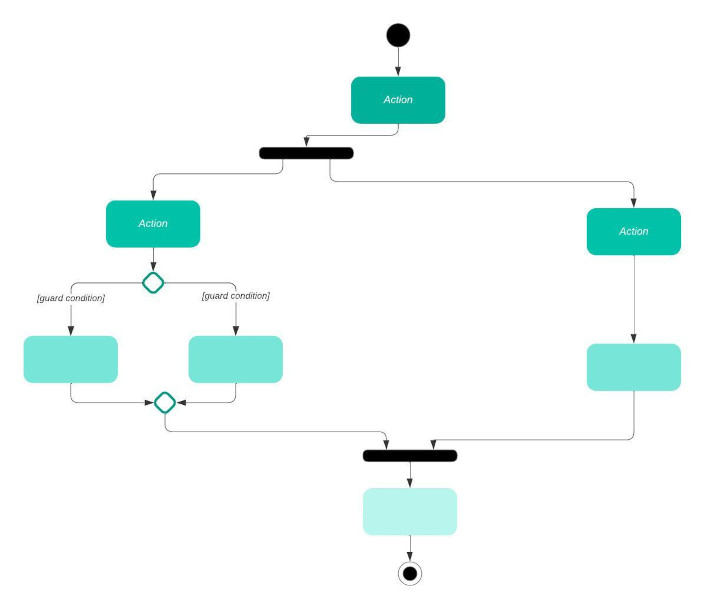
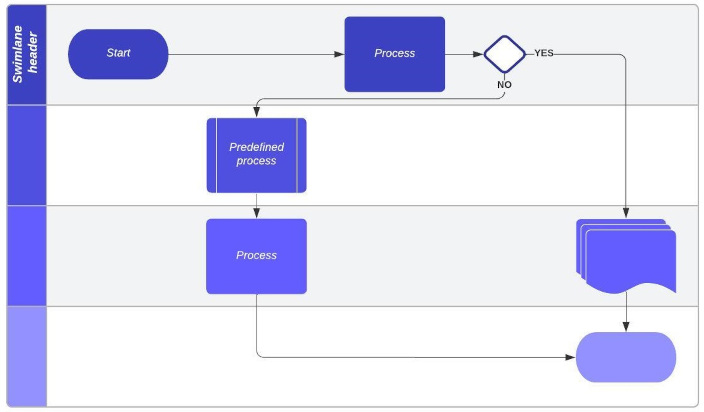
An Activity Diagram is a type of diagram used in software modeling and design to represent the flow of activities, actions, and decisions within a process or workflow. Activity Diagrams provide a visual representation of the dynamic behavior of a system, showing the order in which activities are performed and the conditions that guide the flow. They are part of the Unified Modeling Language (UML) and are commonly used to model business processes, use cases, and complex interactions.
Components of an Activity Diagram
Activity: Represents a specific action, task, or operation that occurs in the system. Activities are depicted as rounded rectangles.
Initial Node: Marks the starting point of the activity flow, indicating where the process begins.
Final Node: Marks the endpoint of the activity flow, indicating where the process concludes.
Decision Node: Represents a branching point where different paths can be taken based on conditions or decisions.
Merge Node: Represents a point where multiple paths merge back together after branching.
Control Flow: Represents the flow of activities from one node to another, typically represented by arrows.
Fork and Join Nodes: Represent parallel execution paths (fork) and synchronization points (join) in the process flow.
Creating an Activity Diagram
Identify the activities, actions, and decisions that are part of the process or workflow.
Arrange the activities in the diagram, considering their sequence and dependencies.
Use control flow arrows to connect activities and show the order in which they are performed.
Use decision and merge nodes to represent branching and merging points.
Include initial and final nodes to mark the beginning and end of the process.
Benefits of Activity Diagrams
Process Visualization: Activity Diagrams provide a clear visual representation of the flow of activities within a process or workflow.
Behavior Understanding: They help developers and stakeholders understand how activities are performed, decisions are made, and conditions are evaluated.
Business Process Modeling: Activity Diagrams are commonly used to model and document business processes and workflows.
Design Validation: They aid in validating that the designed process flow meets the intended behavior and requirements.
Communication Tool: Activity Diagrams facilitate communication among team members and stakeholders about process details.
Documentation: They serve as documentation that describes the logical flow of activities in a process.
Limitations of Activity Diagrams
Activity Diagrams might become complex for processes with numerous activities, decisions, and branching points.
They focus on the flow of activities and decisions but may not provide a complete overview of system architecture or data flow.
In summary, Activity Diagrams are valuable tools for capturing and visualizing the flow of activities and decisions within a software system or process. They help in understanding and communicating complex workflows, validating design choices, and documenting the dynamic behavior of a system.
State Diagrams
A State Diagram, also known as a State Machine Diagram, is a type of diagram used in software modeling and design to depict the various states that an object or system can be in and the transitions between those states. State Diagrams provide a visual representation of the dynamic behavior of a system, showing how it responds to events and how it changes its internal state. They are part of the Unified Modeling Language (UML) and are commonly used to model the behavior of objects, entities, or processes with distinct states.
Components of a State Diagram
State: Represents a condition or mode that an object or system can be in at a particular point in time. States are usually depicted as rounded rectangles.
Transition: Represents a change of state triggered by an event or condition. Transitions are usually represented by arrows connecting states and labeled with the event that triggers the transition.
Initial State: Marks the starting state when the object or system is created or initialized.
Final State: Marks the end state when the object or system completes its processing.
Events: Represent occurrences that trigger state transitions. Events can be external inputs, time-based triggers, or internal conditions.
Creating a State Diagram
Identify the states that the object or system can be in and the events that trigger transitions between those states.
Create state nodes for each state and transitions between states to depict how the system responds to events.
Use decision points (choice nodes) to represent branching points where different events lead to different transitions.
Include initial and final states to mark the starting and ending points of the diagram.
Benefits of State Diagrams
Behavior Visualization: State Diagrams provide a visual representation of how an object or system’s behavior changes in response to events and conditions.
Understanding State Transitions: They help developers and stakeholders understand how an entity transitions from one state to another.
Validation: State Diagrams aid in validating that the system’s behavior is correctly defined and aligned with requirements.
Communication Tool: They facilitate communication about the behavior of objects or systems and how they respond to different events.
Design Documentation: State Diagrams serve as documentation that describes the different states and transitions of an entity.
Limitations of State Diagrams
Complex systems with numerous states and transitions can result in intricate diagrams that may be difficult to understand.
State Diagrams primarily focus on the behavior and transitions, not the internal operations of methods or actions associated with states.
In summary, State Diagrams are valuable tools for capturing and visualizing the dynamic behavior of objects, entities, or processes with distinct states. They help in understanding how the system responds to events and changes its internal state, facilitating communication, validation, and design documentation.
Component Diagrams
A Component Diagram is a type of diagram used in software modeling and design to illustrate the high-level structure of a software system by depicting the components (modules, classes, libraries, etc.) that make up the system and the relationships between them. Component Diagrams provide a visual representation of how the different parts of a system are organized and interact with each other. They are part of the Unified Modeling Language (UML) and are commonly used to depict the architectural design of a software application.
Components in a Component Diagram
Component: Represents a self-contained, modular unit of functionality in the system. A component encapsulates implementation details and provides well-defined interfaces.
Interface: Represents a contract that specifies how a component can be interacted with. It includes the methods, properties, and services that a component expose.
Dependency: Indicates a relationship between components where one component relies on the services or interfaces provided by another component.
Association: Represents a general relationship between components, indicating that they are connected in some way.
Realization: Depicts the relationship between a component and an interface it implements. It signifies that a component is responsible for fulfilling the behavior defined by the interface.
Creating a Component Diagram
Identify the major components and modules that make up the software system.
Define the interfaces and services provided by each component and the dependencies between them.
Arrange the components in the diagram, considering their relationships and interactions.
Connect components using association lines, dependency arrows, and realization arrows to show relationships.
Benefits of Component Diagrams
Architecture Visualization: Component Diagrams provide a clear visual representation of how the software system’s components are organized and interact.
Dependency Management: They help in identifying dependencies between components, which is crucial for maintaining modularity and managing changes.
Communication Tool: Component Diagrams facilitate communication among development teams and stakeholders about the software’s high-level architecture.
Design Documentation: They serve as documentation that outlines the structure and relationships of components in the system.
Limitations of Component Diagrams
Component Diagrams focus on the architectural structure and relationships, but they don’t depict the dynamic behavior or detailed implementation within each component.
Complex systems with numerous components can result in intricate diagrams that may be difficult to comprehend.
In summary, Component Diagrams are valuable tools for capturing and visualizing the high-level architecture and structure of a software system. They help in understanding how different components interact, how dependencies are managed, and how the system’s architecture is organized.
Deployment Diagrams
A Deployment Diagram is a type of diagram used in software modeling and design to illustrate how software components and hardware nodes are deployed and distributed across a physical or virtual infrastructure. Deployment Diagrams provide a visual representation of the relationships between software components and the hardware resources they utilize. They are part of the Unified Modeling Language (UML) and are commonly used to depict the deployment architecture of a software application.
Components in a Deployment Diagram
Node: Represents a physical or virtual computing resource where software components are deployed. Nodes can include servers, devices, clients, and other hardware resources.
Component: Represents a software module or part of the system that performs specific functionalities. Components are deployed on nodes.
Artifact: Represents a physical file or data that is used or produced by a component. Artifacts can be files, libraries, databases, executables, and more.
Deployment Relationship: Connects components to nodes, representing the deployment of the component on a specific node.
Association: Represents a relationship between nodes, components, or artifacts.
Creating a Deployment Diagram
Identify the hardware nodes, software components, and artifacts that are part of the system’s deployment.
Define the relationships between components and nodes, indicating which components are deployed on which nodes.
Arrange the nodes, components, and artifacts on the diagram, considering their deployment relationships.
Use deployment relationships to connect components to the nodes where they are deployed.
Benefits of Deployment Diagrams
Infrastructure Visualization: Deployment Diagrams provide a clear visual representation of how software components are deployed across hardware nodes.
Resource Allocation: They help in understanding how components utilize hardware resources and how the system’s workload is distributed.
Communication Tool: Deployment Diagrams facilitate communication among development teams and stakeholders about the software’s deployment architecture.
Design Documentation: They serve as documentation that outlines how the software system is distributed and executed on hardware resources.
Limitations of Deployment Diagrams
Deployment Diagrams focus on the physical deployment architecture, but they don’t provide insights into the dynamic behavior or internal interactions of components.
Complex systems with numerous components and nodes can result in intricate diagrams that may be challenging to interpret.
In summary, Deployment Diagrams are valuable tools for capturing and visualizing the deployment architecture of a software system. They help in understanding how components are distributed across hardware nodes, how resources are allocated, and how the software interacts with its deployment environment.
Benefits of Modeling
Clarity
Models provide a visual representation that makes complex systems easier to understand and discuss.
Early Validation
Modeling allows for early validation of system designs and behavior before committing to actual implementation.
Consistency
Models ensure that all team members share a common understanding of the system’s architecture and behavior.
Communication
Visual models facilitate effective communication between technical and non-technical stakeholders, reducing misunderstandings.
Documentation
Models serve as documentation that can be referenced throughout the development process and beyond.
Challenges and Best Practices
Over-Modeling
Avoid excessive detailing that may lead to overly complex models, making them harder to understand.
Under-Modeling
Ensure that models capture essential aspects of the system, providing a comprehensive overview.
Consistency
Ensure consistency between different models to avoid conflicting information.
Feedback
Involve stakeholders and team members in reviewing and validating models to ensure accuracy.
In summary, modeling is a critical technique in software development that uses visual representations to simplify, communicate, and analyze complex software systems. It enhances collaboration, reduces misunderstandings, and aids in making informed decisions throughout the development lifecycle.
For additional information on software analysis, please refer to this resource.